Representation Bias
confusing a symbol
for the real thing
Representation Bias
Representation bias refers our tendency to believe that what we use to represent something else actually is what it is supposed to be describing.
The speed that shows up on the dashboard of your car gives you a representation of how fast your car is actually going, same for the number that appears on the police officer's radar. Neither is the car's speed. That's why traffic courts will consider speedometer or radar calibration test results.
When it comes to financial markets it can be argued that the simplest, cleanest information available is price and volume. Even those don't tell the whole story.
While it is possible to invest using just price and volume as the technical data, most people choose more complex representations. When you do that, the possible distortions get bigger.
The principle here is that the further you get from the raw data, the more likely you are to make the mistake of thinking that you are dealing with something that is more tangible or real than it really is, that the representation really is the thing you're trying to make decisions about.
The Most Basic Tool Investors Rely On Is The Bar Chart
 Open-High-Low-Close Bar Chart
The most obvious example of one thing representing something else in investing is the daily bar chart. Investors of all viewpoints can use bar charts to make decisions about their investing. It would be pretty safe so say that 'everybody's doing it, so it must make sense.
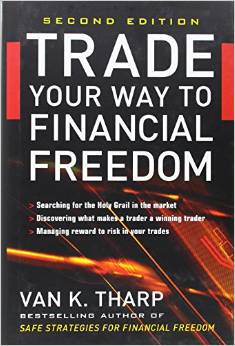
But, as Dr. Van Tharp points out in his book, Trade Your Way to Financial FreedomKnowing what the bar chart does and doesn't tell you is important.
It does tell you such things as
- the price of the first and last trades of the trading session
- the highest and lowest prices of the day
- the distance between the open and the close
- the distance between the high and low of the day
- and more when you place the bars in a series over time
It does not tell you
- the psychology of buyers and sellers
- whether the day's high happened before or after the day's low
- how much activity occurred at each price of the day
- who is buying and selling.
- how many large block trades were
- were buyers getting into long positions or covering short positions
Quoting Dr. Van Tharp on the representation bias again, "The scary thing is that a daily bar, which is at best summary information, is typically the raw data that you manipulate to make your decisions."
As Data Becomes More Complex, Awareness of Dangers of the Representative Bias Takes On More Importance
If the simple Open-High-Low-Close bar chart turns out to be not that simple, consider how far from the thing being represented you can get when you use tools such as
- ratios such a price/earnings, price/sales, price/book value
- moving averages
- Fibonacci ratios
- stochastics
- MACD
Copyright @ 2008 - 2018 Better-Relationships-Over-50.com
